


Global air cargo market demand rose +11% year-on-year for a third consecutive month in March as buoyant e-commerce volumes and concerns over Red Sea ocean freight delivered an unexpected first quarter bonus, according to the latest market data from Xeneta.
In what are typically weaker months of the year for airfreight, the higher volumes outpaced growth in capacity supply in the first quarter of 2024, which increased by +8% year on year. In turn, this produced a jump in the global dynamic load factor, which is Xeneta’s measurement of cargo capacity utilization based on volume and weight of cargo flown alongside capacity available.
Load factor in the opening three months of 2024 rose +2% YoY to 59%, and March has shown similar growth, edging up to 61%.
Xeneta’s chief airfreight officer, Niall van de Wouw, commented: “While this latest monthly data should be balanced against the lower base recorded in the corresponding month of 2023, when we saw weakened global manufacturing activities, Q1 2024 has still seen a surprisingly busy airfreight market. Demand in the first quarter doesn’t indicate a market which is running out of steam so far.
“The question is, should we be surprised by it, or should we get used to it? Although the market didn’t benefit immediately, the Red Sea disruption was clearly a factor in these latest figures. Airfreight growth was primarily driven by increased volumes from the Middle East and South Asia as shippers shifted services from ocean to air to avoid Red Sea delays. We also cannot underestimate the importance of e-commerce growth, which shows no sign of abating on its most prominent lanes.”
Subsequently, the average global airfreight spot rate in March increased +7% from the previous month to US$2.43 per kg.
On the corridor level, as highlighted, the Middle East and South Asia to Europe market continued to lead growth in rates in March as the upsurge in air cargo demand caused by Red Sea concerns squeezed capacity on these lanes. The average spot rate on this corridor jumped +46% over February’s level to $2.82 per kg, up +71% year-on-year. This was especially seen in the India outbound market, where the spot rate to Europe rose 68% month-on-month in March to $3.38 per kg.
In contrast, the average ocean containerized spot rate on the India West Coast to North Europe lanes declined -9% after its peak in February, although this remained +340% above December, prior to the Red Sea disturbance.
The Middle East and South Asia to US air cargo market followed suit. Its average spot rate of $4.03 per kg in March was up +35% month-on-month and +51% year-on-year.
In comparison, the spot rate from Europe to the US increased only marginally by +3% month-on-month to $2.12 per kg as this corridor was less affected by the Red Sea.
China outbound experienced a decline in spot rates versus February 2024 as the market cooled down after the Lunar New Year.
The China to US market spot rate of $4.06 per kg slipped down -2% month-on-month, although, year-on-year, growing e-commerce demand and delayed recovery of belly capacity contributed to a noticeable +15% average jump in spot freight rates. Similarly, the China to Europe spot rate decreased -3% month-on-month to $3.64 per kg. However, it increased +5% over the previous year, boosted primarily by e-commerce demand and the shift away from the Red Sea.
The South America outbound market registered the largest decline among the top air cargo corridors. As demand for flowers eased, the South America to US spot rate dropped -12% from the previous month to $1.25 per kg in March, down -7% on the previous year. South America to Europe experienced a similar trend, with spot rates averaging $1.75 per kg, a fall of -18% month-on-month and -11% year-on-year.
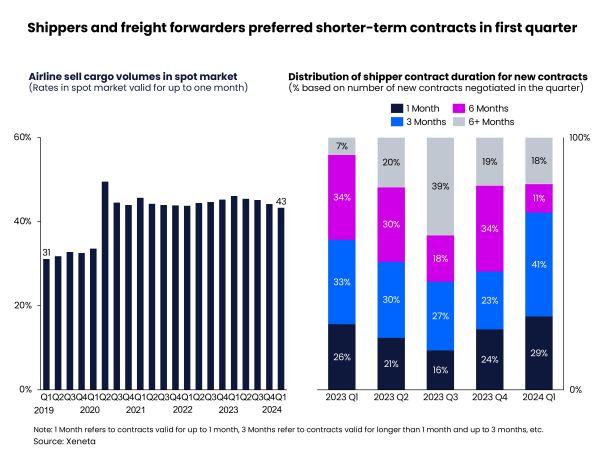
March data shows freight forwarders continuing to purchase a larger share of volumes on the spot market as they kept their options open pending an anticipated cooling down of the Red Sea disruption, and to benefit from the traditionally more imbalanced demand/supply ratio caused by the influx of airline belly capacity at the start of summer schedules. In the first quarter of 2024, spot market share accounted for 43% of the total – compared to 31% in the corresponding pre-pandemic era – as expectations of ‘normalization’ prompted forwarders to take short-term risks in the spot market in the hope of longer-term gains.
Similarly, in the first quarter of 2024, more shippers pivoted away from longer-term global air cargo contracts to short-term capacity commitments, with three-month contracts accounting for 41% of all newly negotiated contracts in this quarter, up +18% pts from the previous quarter. The preference for six-month contracts declined 23% pts versus the previous quarter.
Wouw concluded: “The air cargo market has clearly enjoyed a stronger-than-anticipated start to the year, but there’s a different quarter coming along and more capacity coming in, so we do expect an overall downward pressure on load factors and rates, aside from selected corridors where the continuing rise of e-commerce and the residue of the Red Sea uncertainty will continue to boost rate levels.
“But this is now six months in-a-row that the air cargo market has been stronger than we expected. When is it going to slow down? Only time will tell but, right now, airfreight demand is surprisingly resilient.”